Beyond the scoreboard: Statistical anomalies driving prop bet interest in team sports competitions
Jonas Frank · Jun 9, 2026

Beyond the scoreboard: Statistical anomalies driving prop bet interest in team sports competitions
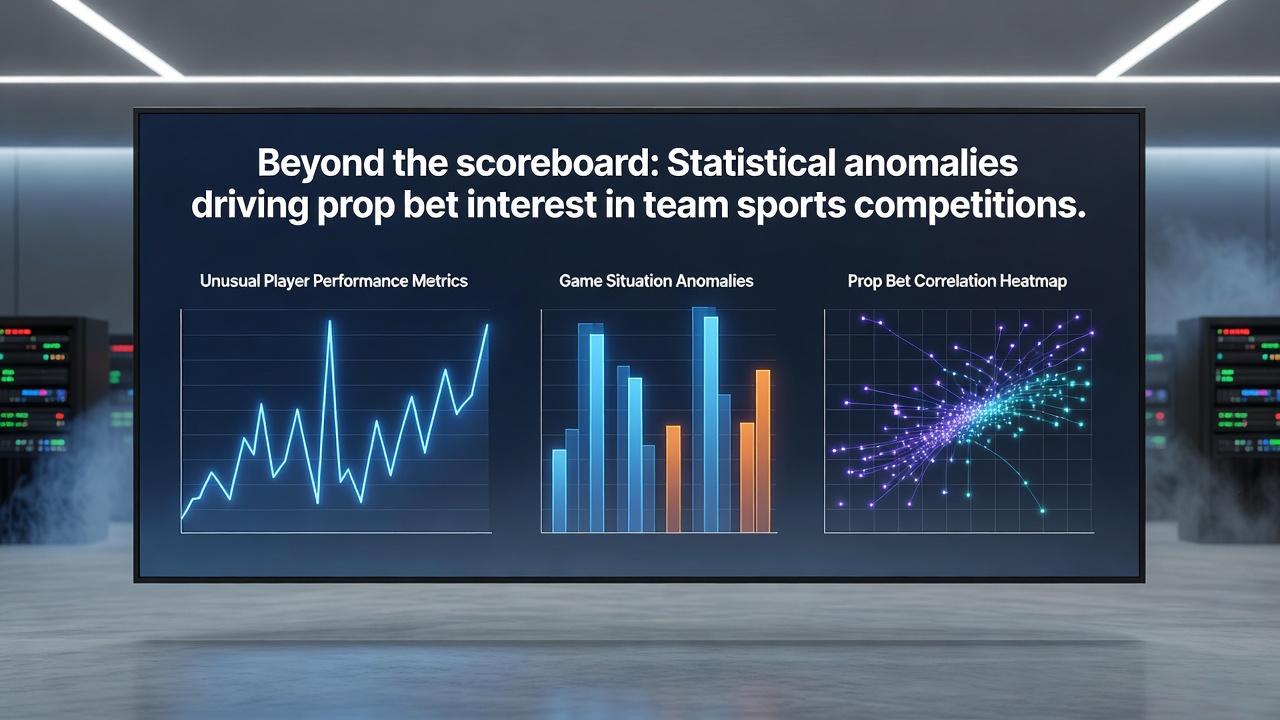
Data indicates that prop bets in team sports have gained traction through patterns where individual player metrics diverge from expected norms even as team results stay consistent and observers note how these divergences create focused wagering opportunities separate from traditional match outcomes. Researchers at institutions like the University of Michigan's sports analytics programs have tracked how metrics such as assist-to-turnover ratios in basketball or pass completion percentages under pressure in soccer often reveal repeatable anomalies that align with specific game situations and betting markets respond by adjusting lines accordingly while data from the Nevada Gaming Control Board shows increased volume in these categories during the 2025-2026 seasons.
Identifying key statistical anomalies across sports
Patterns emerge when players exceed or fall short of projected benchmarks in isolated categories and these stand out because team victories continue without corresponding changes in overall standings or league averages. In baseball for instance analysts have documented cases where certain hitters maintain elevated on-base percentages in day games versus night contests yet their teams post identical win rates across both conditions and this separation fuels prop interest in hits or walks without tying directly to final scores. Similar observations appear in hockey where faceoff win rates for centers fluctuate based on zone starts but team possession metrics remain stable and bettors examine these splits for edges in player-specific markets.
Studies from academic sources highlight how anomalies often cluster around situational factors like rest days or travel schedules and one analysis of NBA data revealed players averaging higher rebound rates after back-to-back games despite reduced minutes yet their teams' defensive efficiency stayed constant. Such findings encourage deeper examination of granular stats and prop markets expand to capture these nuances as volume grows in categories like rebounds assists or shots on target.
How anomalies influence prop bet structures
Bookmakers adjust prop lines when historical data reveals consistent deviations and this process draws from broader datasets that include opponent adjustments and venue effects while bettors track these shifts through available tracking tools. In football competitions anomalies around quarterback completion rates on third downs have prompted specialized markets and figures reveal spikes in interest during playoff stretches where these rates diverge from regular season baselines without altering team advancement probabilities.
What's interesting is how these patterns persist across multiple seasons and allow for comparative analysis between conferences or leagues and external data from the Australian Communications and Media Authority indicates rising engagement with such micro-markets in rugby and cricket where player-specific stats like tackle success or boundary counts show similar outlier behaviors independent of match results. The integration of real-time tracking systems has accelerated this trend since anomalies surface faster during live events and create windows for adjusted propositions.
Role of data tracking in highlighting opportunities
Advanced metrics platforms compile play-by-play information that isolates individual contributions adn this granularity helps surface anomalies that traditional box scores overlook and teams themselves use similar systems for internal reviews yet public access has expanded prop participation. Observers note that in June 2026 several European soccer leagues featured standout performances in expected goal differentials per 90 minutes for forwards whose clubs maintained mid-table positions and these instances correlated with heightened activity in goalscorer props.
Case examples include basketball guards who post elevated steal rates against specific defensive schemes without corresponding changes in team win percentages and researchers have compiled multi-year datasets confirming the repeatability of these edges. Bettors therefore focus on opponent matchup histories and usage rates to identify when anomalies align with favorable conditions and this approach keeps prop interest distinct from broader game betting.
Broader market responses and participation trends
Industry reports from organizations such as the European Gaming and Betting Association document how prop bet offerings have diversified in response to demand for statistical depth and this expansion occurs alongside stable overall participation rates in team sports wagering. Anomalies drive the creation of new categories like zone-specific passing accuracy or penalty minute distributions in hockey where data shows consistent player-level variations that do not predict team standings shifts.
Participation remains concentrated among those who review historical splits and situational filters and regulatory frameworks in various regions support transparent data reporting that underpins these markets. The separation between team outcomes and individual anomalies allows prop betting to operate as a parallel activity and this structure sustains interest through ongoing seasons.
Conclusion
Statistical anomalies continue to shape prop bet development in team sports by providing measurable divergences that stand apart from collective results and data sources across regions confirm sustained tracking of these patterns through 2026. As tracking technologies advance and datasets grow the focus on individual metrics within stable team environments supports expanded market options while maintaining objective foundations in available performance records.